The Working Class in Austin by Numbers

Every once in a while I find myself doing my own little research projects for purely my own self-indulgence. This is one of them and maybe others will find it useful for your own purposes. (Still doing research on the racial, ethnic, gender etc demographics.)
- 555,010 Austinites earn less than $50,000 a year (65 percent of the workforce
- Union membership is a pitiful 2.5 percent half that of Texas's 4.5 percent average (which is less than half of the national average).
- 78,800 Austinites earn less than $21,000 a year.
- 61,370 Austinites make more than $100,000 a year.
- Real income has risen by 2.5 percent in the past four years—but housing prices have increased by 40 percent.
- 54.4 percent of the working class in Austin rent their housing.
- 16 percent of Ausinites work in traditional “blue collar” occupations (construction, warehousing, transportation, and manufacturing).
- The fast growing occupation by industry is logistics (warehousing and transportation) the sector created more than 6,000 jobs last year.
- Tech workers only make up 6 percent of the workforce. Food service makes up 10.6 percent in comparison.
- The State of Texas is the largest employer.
- Education and healthcare employment are the two biggest employment sectors by industry.
- Managers makes up 5.3% of employment, interestingly the exact national average (which I do not include here along with rentiers, the self-employed, the independently wealthy, etc for obvious reasons).

Employment by Industry, Austin Metro Area
2013
|
2014
|
2015
|
2015
|
2017
|
|
|---|---|---|---|---|---|
Total
non-farm
|
884,000
|
923,100
|
963,300
|
1,000,500
|
1,032,600
|
Construction,
natural resources & mining
|
46,000
|
50,700
|
55,300
|
58,800
|
61,500
|
Manufacturing
|
57,200
|
57,200
|
55,600
|
55,800
|
57,100
|
Wholesale
trade
|
43,700
|
45,300
|
48,100
|
49,500
|
51,500
|
Retail
trade
|
93,800
|
97,600
|
100,300
|
104,000
|
105,400
|
Transportation,
warehousing, & utilities
|
14,800
|
15,600
|
16,400
|
18,400
|
20,200
|
Information
|
23,900
|
25,300
|
27,700
|
28,900
|
30,100
|
Financial
activities
|
49,300
|
51,900
|
54,100
|
56,800
|
59,700
|
Professional
& business services
|
139,300
|
150,400
|
161,000
|
169,100
|
176,300
|
Educational
& health Services
|
102,500
|
106,400
|
111,600
|
115,600
|
120,300
|
Leisure
& hospitality
|
100,600
|
107,100
|
115,500
|
122,000
|
125,900
|
Other
services
|
40,600
|
42,300
|
42,700
|
43,800
|
44,900
|
Government
|
172,200
|
173,200
|
175,200
|
178,100
|
179,800
|
Employment By Occupation and Mean Hourly Wages
Occupational
groups
|
Percent
of total employment
|
Mean
hourly wage
|
|||
|---|---|---|---|---|---|
National
|
Austin
|
National
|
Austin
|
||
Total,
all occupations
|
100.0
|
100.0
|
$24.98
|
$25.87*
|
|
Management
|
5.3
|
5.3
|
58.44
|
59.04
|
|
Business
and financial operations
|
5.3
|
6.3*
|
36.98
|
35.61*
|
|
Computer
and mathematical
|
3.0
|
6.0*
|
44.01
|
44.22
|
|
Architecture
and engineering
|
1.8
|
2.6*
|
42.01
|
44.61*
|
|
Life,
physical, and social science
|
0.8
|
0.9
|
36.62
|
33.16*
|
|
Community
and social service
|
1.5
|
1.1*
|
23.69
|
22.96
|
|
Legal
|
0.8
|
1.1*
|
52.25
|
46.85*
|
|
Education,
training, and library
|
6.1
|
5.8
|
27.22
|
26.48
|
|
Arts,
design, entertainment, sports, and media
|
1.3
|
1.8*
|
28.74
|
29.76
|
|
Healthcare
practitioners
|
6.0
|
4.6*
|
39.42
|
37.58*
|
|
Healthcare
support
|
2.8
|
2.1*
|
15.57
|
16.74*
|
|
Protective
service
|
2.4
|
2.1*
|
23.36
|
23.23
|
|
Food
service
|
9.2
|
10.6*
|
12.30
|
12.64*
|
|
Building
and grounds cleaning and maintenance
|
3.1
|
2.9*
|
14.43
|
13.34*
|
|
Personal
care and service
|
3.8
|
2.9*
|
13.51
|
12.84*
|
|
Sales
and related
|
10.0
|
11.0*
|
20.09
|
23.22*
|
|
Office
and administrative support
|
15.1
|
16.9*
|
18.75
|
19.04*
|
|
Farming,
fishing, and forestry
|
0.3
|
0.1*
|
14.49
|
14.99
|
|
Construction
and extraction
|
4.1
|
4.3
|
24.62
|
20.79*
|
|
Installation,
maintenance, and repair
|
3.9
|
3.4*
|
23.54
|
22.38*
|
|
Production
|
6.3
|
3.6*
|
18.84
|
17.98*
|
|
Transportation
and material moving
|
7.1
|
4.6*
|
18.41
|
16.60*
|
|
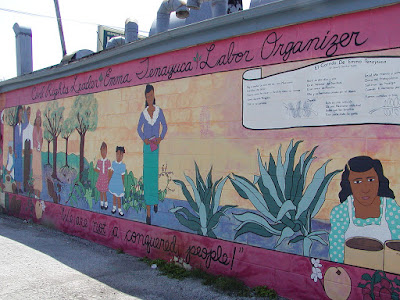
That photo brings back memories. Brenda was the last person I hugged before lockdown.
ReplyDelete-gaven